Most cybersecurity board reports fail before the discussion even begins. They arrive packed with red and amber tiles, and a patch percentage stapled to the bottom of the slide. Directors nod and ask whether the company is covered. Then the agenda moves on. The meeting moves on because the report provides data but does not enable decisions.
I have sat on both sides of that table, and seen first-hand what works (as well as what doesn’t).
An actionable board-ready report translates the security program into the language a board is fluent in: they quantify what's at stake, put the financial impact into context, and make clear what decision the board is being asked to make.
Every cybersecurity board report should answer these key questions:
Are we more exposed than last quarter?
Are we more exposed than our peers?
What are we doing about it?
How is the program being monitored and continuously improved?
A report that answers those questions on the first page gives directors something to act on. The five steps below show you how to build that report from the data a mature program already has.
TL;DR
A board asks whether its exposure is worse than last quarter, whether it is worse than its peers, and what the company is doing about it. A board-ready report answers all these questions on the first page.
The report is built in five steps. Price the exposure in dollars. Show the highest-exposure attack paths. Assign a Remediate, Mitigate, or Accept decision to each. Benchmark the trend against last quarter and peers. Close with specific asks. Every step converts a technical security fact into a risk management and governance decision.
The unit a board acts on is expected loss. A dollar figure turns a technical score into a number the board can weigh like any other risk.
A cyber risk report earns its place on the agenda when it enables directors to allocate capital.
Step 1: Lead With the Exposure in Dollars
The first number on the page is total expected loss in dollars, because that is the only figure a board can weigh against every other risk it governs.
A count of critical vulnerabilities gives a director nothing they can weigh against the company's other risks and needs, which all arrive priced in dollars: budget requests, headcount, legal exposure, capital projects.
How Cye prices the exposure: CoB × LoB
Getting to that number isn't a simple calculation. It's derived by combining attack path analysis with models that estimate both the probability and financial impact of a breach, producing a quantified measure of business exposure.
Cye's model expresses exposure as Cost of Breach multiplied by Likelihood of Breach, so the output is a dollar figure a director can weigh alongside any other line on a balance sheet.
The Cost of Breach side draws on real breach data. Cye’s model is based on an individual organization’s own data, as well as more than 250,000 verified breach records. It explains 93% of the variation in real breach cost (R²=0.93) (Cye).
Any organization can estimate its own Cost of Breach with Cye's Cost of Breach Estimator. Across more than 500 organizations, the platform has quantified over $20 billion in exposure and analyzed more than a million attack paths.
The likelihood calculation starts with the validated attack paths in your own environment. A mature continuous threat exposure management (CTEM) program continuously identifies and validates which attack paths are actually exploitable, not just theoretically possible.
Run as a continuous loop, CTEM produces and continuously updates a confirmed map of which routes in your environment are actually exploitable given your current controls, not just a list of what appears on a scanner report (Gartner's CTEM framework, introduced 2022).
Because those confirmed paths are what feed the simulation, the probability it produces reflects your real environment, not a generic model. Each validated path runs through Cye's Org Attack Graph, where a Monte Carlo simulation plays it forward many times over, varying the assumptions about attacker behavior and control effectiveness on every pass. The output is a probability distribution built from your own environment rather than a single static guess.
It maps the full range of potential losses, so directors can see the median outcome alongside the tail event (a low probability but high impact exposure) a determined attacker would produce.
They can also see how much exposure the company carries at different confidence levels.
CTEM and CRQ work together
Continuous threat exposure management maps and validates which routes are reachable. Cyber risk quantification is the layer on top that turns CTEM’s prioritization from a severity ranking into a financial one.
What the dollar figure includes
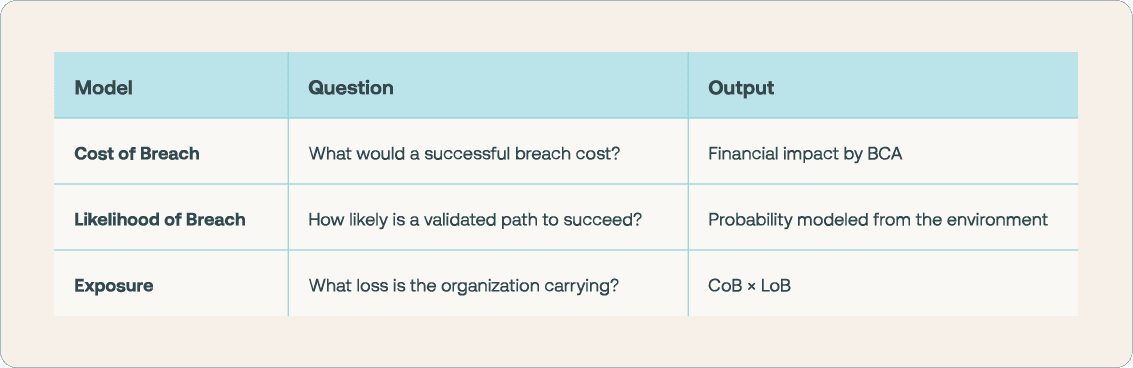
In Cye’s model, the dollar figure is not only the direct incident cost. It covers a range of expenses beyond the invoices you may expect to pay and the salaried hours mobilized, in response to a breach.
Looking beyond immediate costs is what makes the figure defensible. The largest part of a breach is often the part that never lands on an invoice.
“Reputational damage accounts for roughly 60% of total expected breach cost for companies with more than $5 billion in annual revenue.”
Operational impacts from reputational damage include lost pipeline, eroded customer trust, churned customers, and more. All that comes on top of the direct technical cost, and doesn’t necessarily come through in an invoice.
A report that shows only the forensics-and-remediation bill understates the real number by more than half. A board that approves against the understated figure is under-resourcing the risk without knowing it.
Step 2: Show the Attack Paths That Impact the Business
The headline number tells the board how much risk exists. The next step is showing where that risk comes from.
Instead of pages of vulnerabilities or CVSS scores, show the handful of attack paths responsible for the greatest financial exposure.
An attack path is the sequence of steps an attacker could realistically take to reach a business-critical asset (BCA), starting from an initial compromise, through privilege escalation or credential theft, to the systems that matter most.
For example: A phishing email compromises an employee laptop. Cached credentials provide access to an over-permissioned service account. That account provides a path to the finance environment containing the general ledger, exposing $18.7M of expected annual loss.
Even directors with no technical background can immediately understand what is exposed, why it matters, and what needs to change.
The board doesn’t need to know that there are 12,000 open findings. It needs to know that four of them combine to create the organization's highest-risk attack path, and that fixing a single shared credential would break every route leading to the general ledger.
Those shared weaknesses are choke points: single controls that sit across multiple attack paths. Eliminating one can remove millions of dollars of exposure with a single remediation effort.
Remediating choke points typically delivers the highest return on security investment because a single fix can eliminate multiple attack paths.
KEY INSIGHT
Give a board a dollar figure, a trend, and one decision to make. Everything else on the security slide is detail it cannot act on.
Step 3: Assign a Remediate, Mitigate, or Accept Decision to Every Path
Showing the risk is only half the job. Every critical attack path should end with a clear recommendation. Should the organization remediate the risk, mitigate it through compensating controls, or formally accept it? Without that recommendation, the board is left interpreting the data instead of making a decision.
Remediate. Close the path directly, usually by fixing the permission, trust, or configuration at the point where several routes converge. This is the recommendation for routes on a direct line to a business-critical asset.
Mitigate. Reduce the likelihood or impact of the attack path by introducing compensating controls, such as network segmentation, tiered administration, or tighter access controls, when full remediation isn't practical this cycle.
Accept. Formally accept the residual risk when the financial exposure is justified by the cost of remediation. Every accepted risk should have a named owner, a review date, and defined triggers, such as a new attack path or a material change to the environment, which should prompt an earlier reassessment.
Risk acceptance is a board-level decision. When directors formally accept the residual risk associated with an attack path, they create a documented, defensible record that the exposure has been understood, evaluated, and consciously accepted. This is what regulators and insurers look for. The report should show which paths the program recommends accepting and what the accepted exposure totals.
Ranking remediation options by return
Every remediation option in the report should carry a rank. The ranking criterion is risk reduced in financial terms (the expected loss a given action removes, divided by what it costs to implement). That is the return-on-remediation ratio a board allocating capital needs to make a defensible decision.
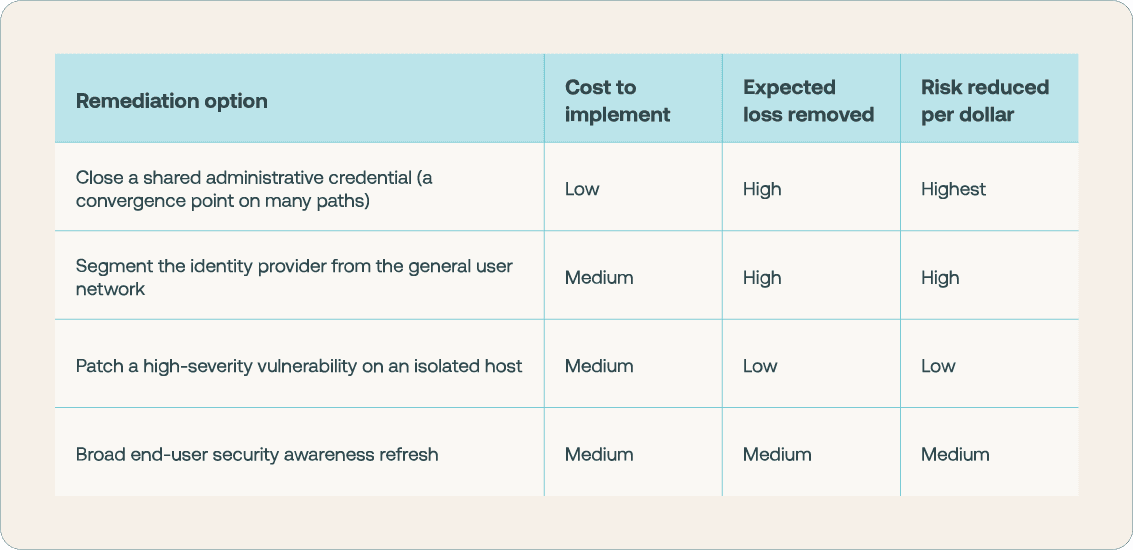
Figures will vary by organization. What consistently holds is that the highest-severity technical finding (as ranked by CVSS) is rarely the highest-return remediation action.
Decision-making improves when the board can compare the outcomes of different remediation options before committing budget. Cye's What-If Analysis models the impact of each option in advance, showing how proposed changes affect attack paths, reduce financial exposure, and improve cyber resilience before a single control is implemented.
Step 4: Benchmark the Trend Against Previous Reports and Peers
The exposure number is more powerful with context. Show how it has changed since the previous report and how it compares with industry peers. Together, those comparisons show whether the organization's cyber exposure is reducing and whether it's improving faster than the market.
The trend line
A board wants to see that total exposure is falling and to know which remediations drove the drop. That is the direct evidence that the last budget it approved produced a return.
Being able to produce that information almost on demand is more important than ever.
Google Mandiant found that the median time between a vulnerability's public disclosure and its first observed exploitation has officially gone negative (to minus seven days) meaning exploitation now routinely begins before a patch is even available (Mandiant M-Trends 2026).
That window continues to compress. Anthropic's research found that frontier AI models can produce a working exploit for a known CVE in under an hour (Anthropic).
Attackers are moving faster than ever. Cybersecurity teams need to build systems that enable them to keep pace. That means adopting a continuous CTEM approach, supported by capabilities such as attack path mapping, cyber risk quantification, modeling, and board-ready reporting.
This is exactly what Cye's platform is built to show. It maps, validates, prices, and recalculates exposure continuously, presenting the result as a trend on a live dashboard. A board can watch how total exposure has moved quarter over quarter instead of reading a single point-in-time snapshot.
The peer benchmark
The peer benchmark puts the exposure number into context. Seeing that the organization's exposure is above the sector median for comparable companies gives directors the context they need to judge whether additional investment or a different strategy is required.
Cye builds this benchmark from the same database of more than 250,000 verified breach records that underlies the Cost of Breach model. Each record is tagged by industry, revenue band, region, and more. With it, Cye can place the company's total expected loss on a distribution of organizations in the same sector and size bracket and show where it sits relative to the median.
The same benchmark updates as your exposure and your peers' exposure change. The board can see whether the gap to the sector median is widening or closing, not just where it stands today.
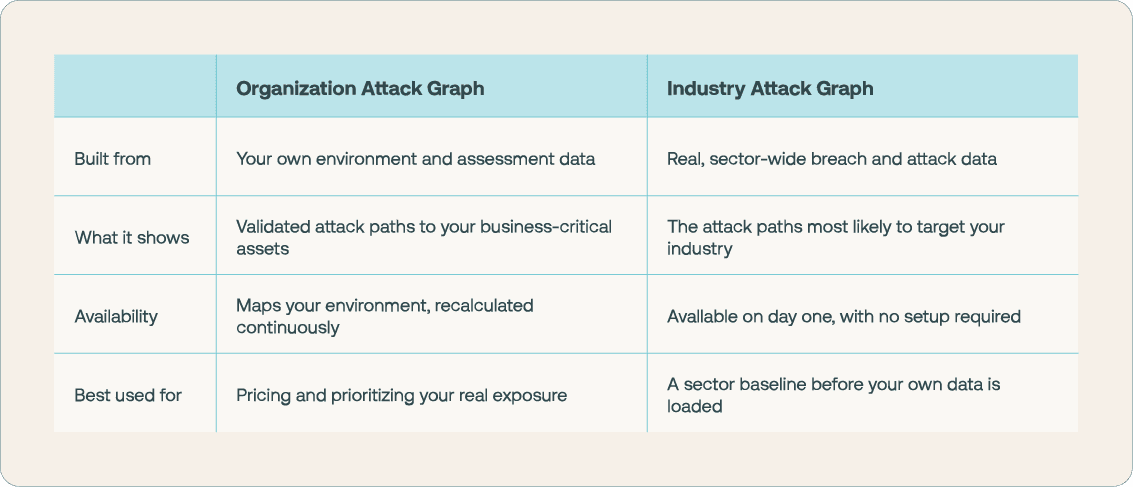
That sector data also powers Cye's Industry Attack Graph. While the Org Attack Graph maps the validated paths inside your own environment, the Industry Attack Graph gives day-one insight into the attack paths most likely to target your industry, before any of your own data is ingested.
Step 5: Close With One Specific Ask
Every board-ready report ends by asking for one specific decision, framed as a return. A slide that trails off into “questions?” wastes the one thing a board convened to do.
“We request approval of a defined budget to close the three attack paths that carry the largest share of our exposure, which our modeling shows removes a stated amount of expected loss this fiscal year.”
Where exposure exceeds what the company can economically remediate, the ask should name the residual risk and how it will be carried. Cyber insurance belongs here as a transfer mechanism for the exposure the company has chosen not to remediate.
Show the accepted residual next to the coverage limit, and the board can judge whether the transfer is adequate instead of assuming a policy makes the risk disappear.
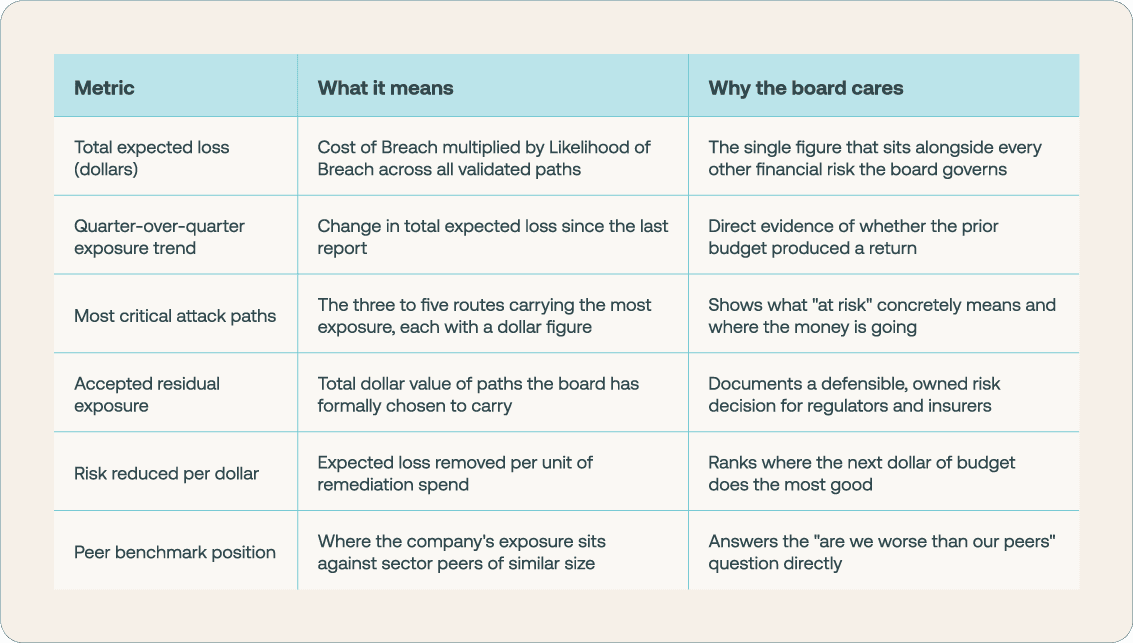
A Board-Ready Metrics Reference
Boards ask for a consistent set of measures they can track quarter over quarter. Below are the metrics that belong in the report, with what each one is for. Each connects to a business question a director can act on.
Match the Report to the Audience in the Room
The full board, the audit committee, and the CFO each need a different cut of the same underlying numbers. A report that serves all three well is built in layers.
The full board needs the one-page version. That covers total exposure, the trend, the highest-exposure paths, and the ask.
None of it requires a security background to read.
The audit committee needs detail about the governance layer beneath it. That means showing which residual paths were accepted, by whom, with what review dates, and how the program maps to a recognized framework such as NIST Cybersecurity Framework 2.0. This is the committee that has to defend the process to regulators.
The CFO needs the capital-allocation layer. Show them risk reduced per dollar across the remediation options, the residual exposure carried against insurance coverage, and the multi-quarter trend that shows how security spend is reducing total dollar exposure over time.
Built in layers like this, one quantified foundation serves every audience, far more credibly than three disconnected decks that tell slightly different stories.
Cye's platform generates that foundation. Cye AI produces the report each audience needs automatically from its own environment data. Security leaders no longer need to rebuild those reports by hand.
A report that earns the decision
A board does not need a security briefing. It needs a dollar figure it can weigh against every other risk, a ranked list of the paths that carry the most of it, a clear recommendation on each, and one specific ask to approve.
The five steps above produce each of those elements from the outputs a mature cybersecurity program already generates.
Together they build a report that earns a decision, and makes the follow-up possible when next quarter's trend line reports against what the board approved this quarter.
Further Reading
The Complete Guide to Cyber Risk Quantification, how the Cost of Breach times Likelihood of Breach model produces the dollar figure a board report leads with: https://cyesec.com/blog/the-complete-guide-to-cyber-risk-quantification
The Essential Guide to Vulnerability Prioritization, how priced attack paths rank remediation by business impact rather than technical severity: https://cyesec.com/blog/vulnerability-prioritization
Understanding the 5 Stages of the CTEM Framework, the continuous program that validates which attack paths are reachable before they are priced: https://cyesec.com/blog/ctem-framework
Cye AI board reporting demo, a walkthrough of how Cye generates customizable board-ready reports from your own environment data: https://www.youtube.com/watch?v=7GBbA6OHMT4
Frequently Asked Questions
A board-ready report leads with total expected loss in dollars, shows the top three to five most critical attack paths, assigns a Remediate, Mitigate, or Accept decision to each, benchmarks the exposure trend against last quarter and against peers, and closes with one specific budget or policy ask. It deliberately omits vulnerability counts and tool-by-tool status, along with any technical detail a director cannot act on. The organizing principle is that every item on the page resolves to a decision the board can make.