Mastering CTEM with Cye platform’s Exposure Assessment and Mitigation
Learn how Cye platform can help you master continuous threat exposure management (CTEM) so you can make better security decisions.
DOWNLOAD NOW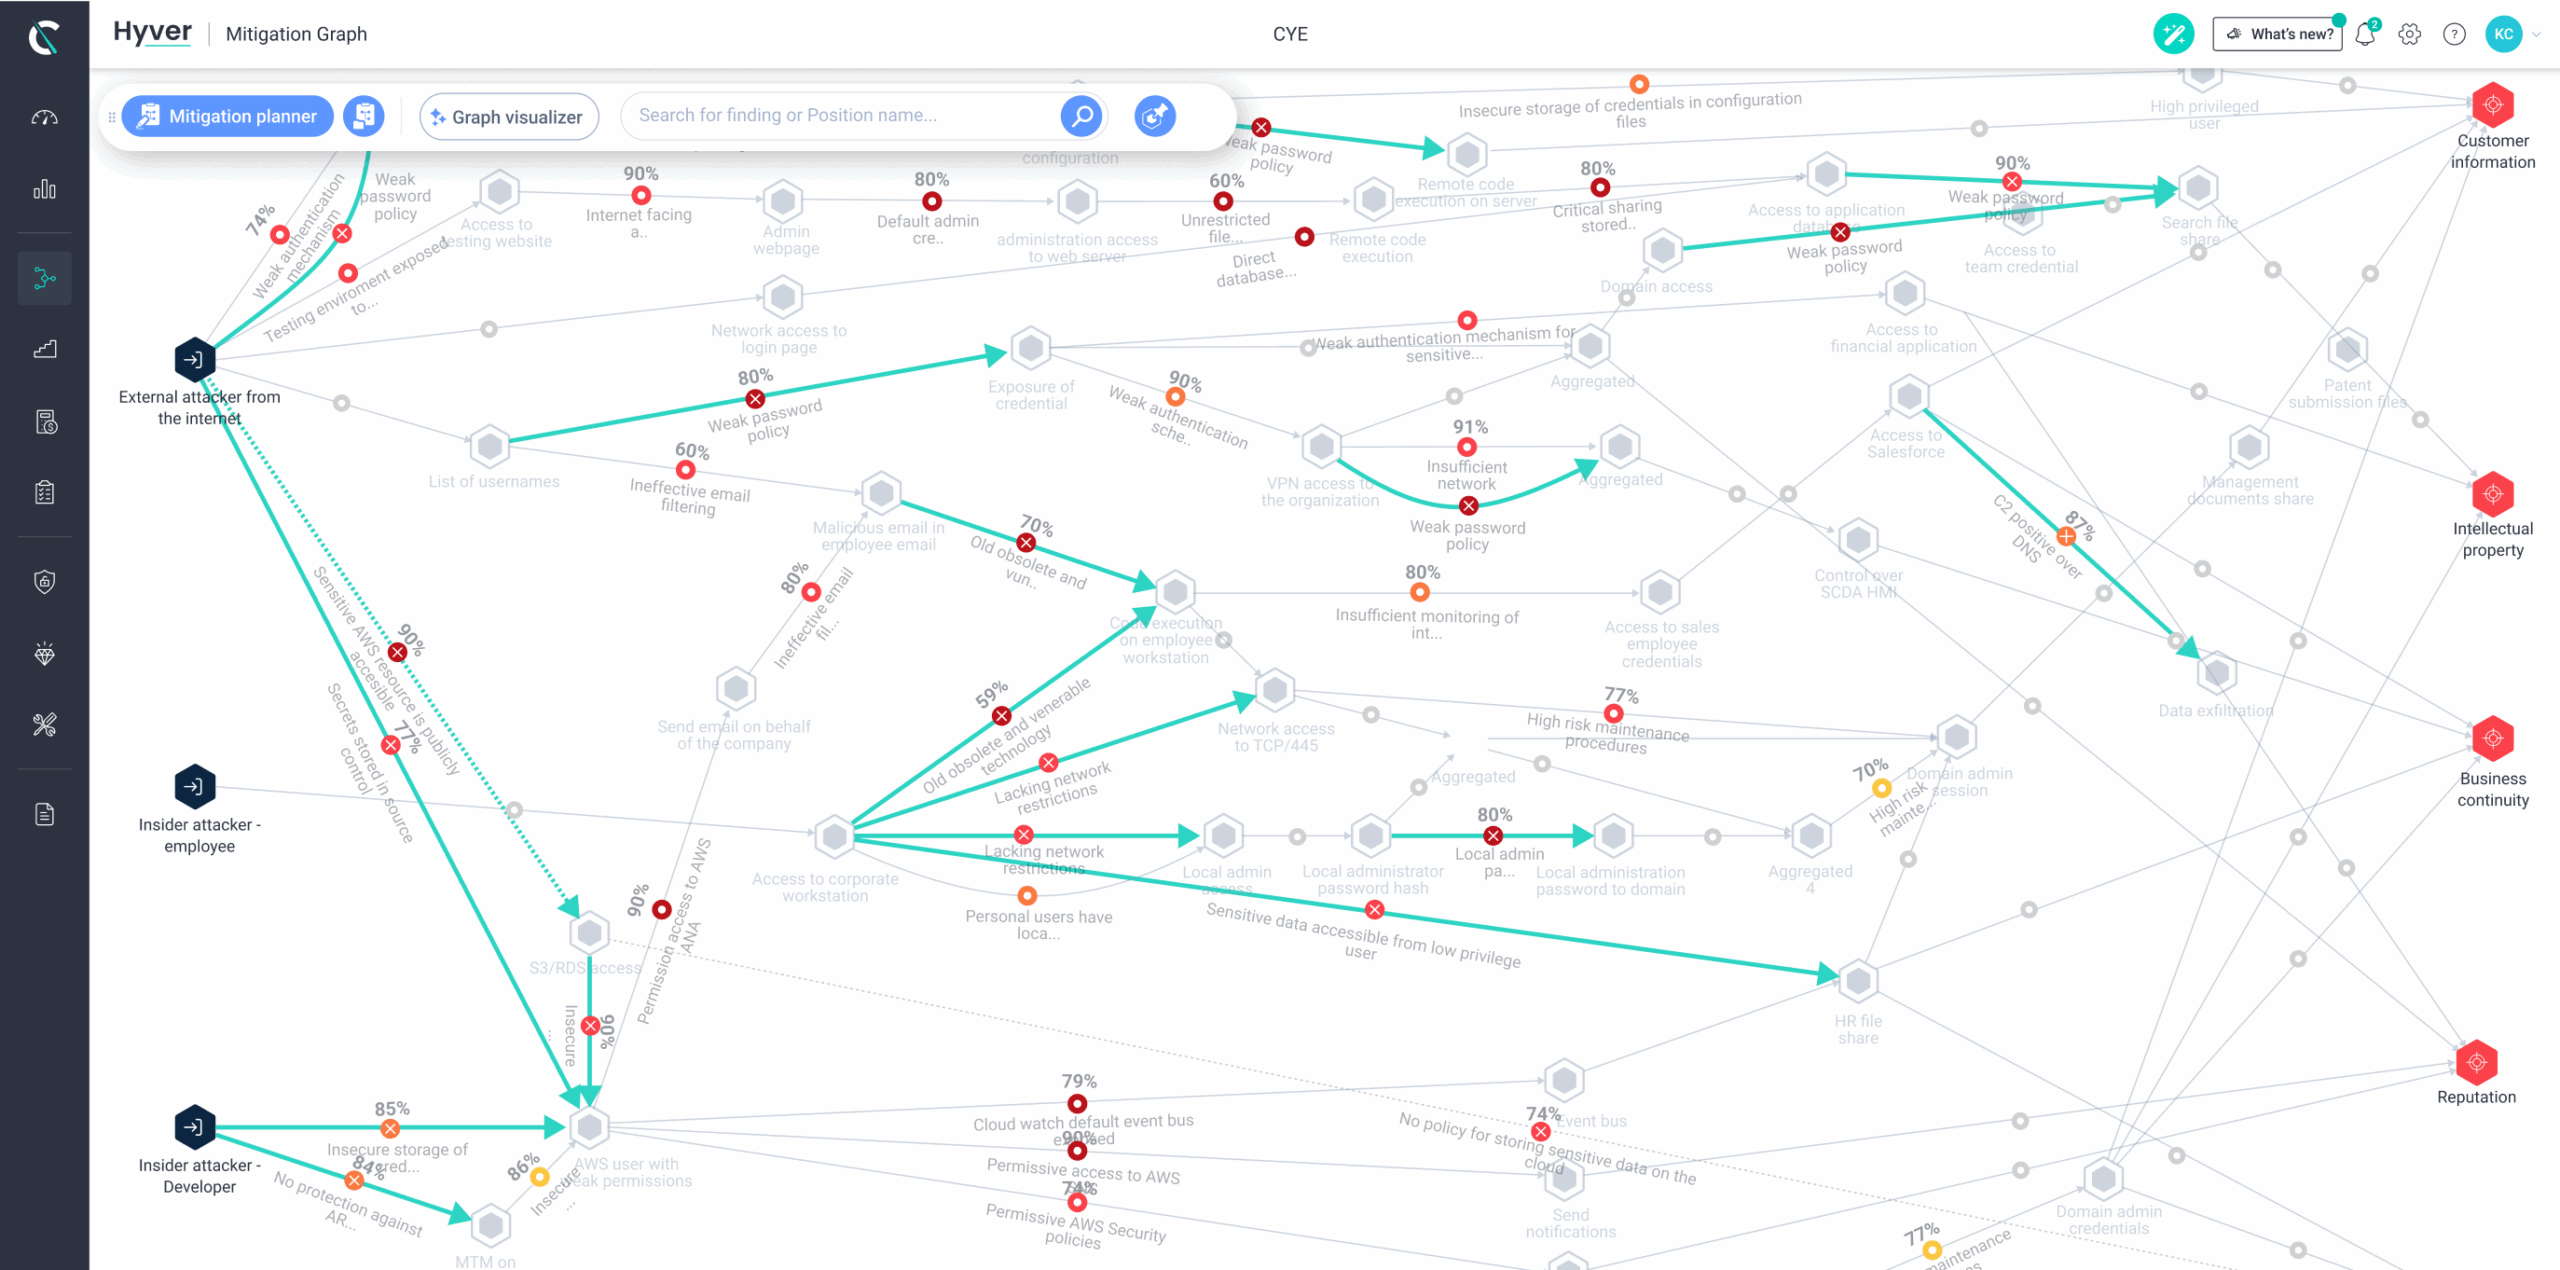
By using findings from organizational risk, pentesting assessments, and security tools, Cye platform visualizes exposure from threat sources to your critical business assets. It employs graph theory, which identifies the chokepoints to drive the most effective mitigation actions.
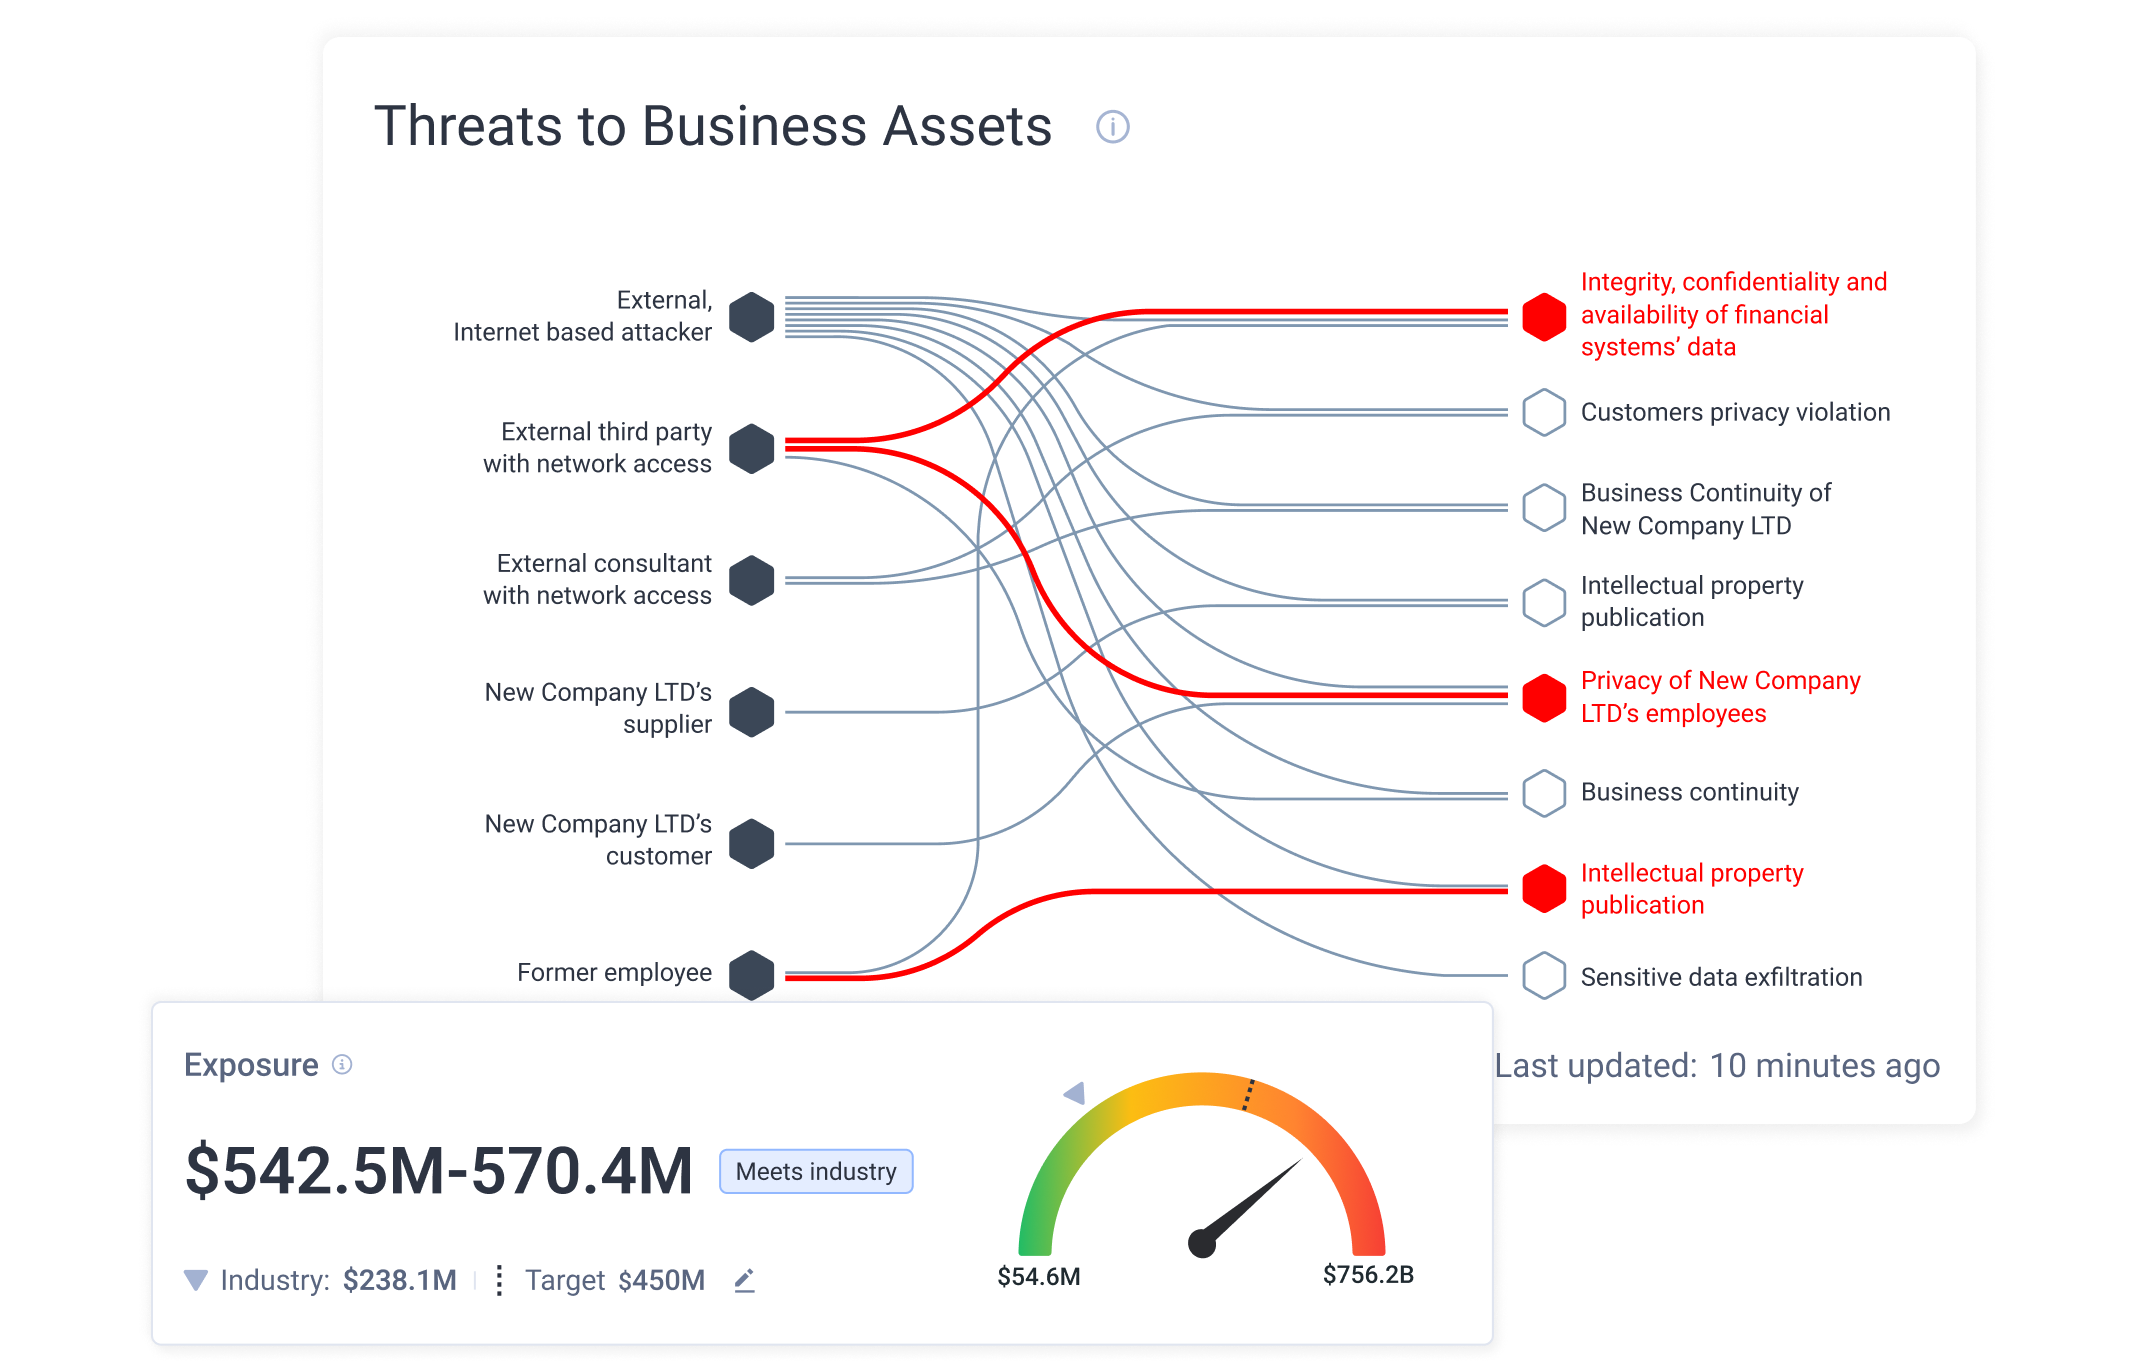
Using threat modeling based on the MITRE ATT&CK framework, Cye platform discovers the likelihood of threats to be exploited by hackers to reach business assets such as customer information, intellectual property, employee information, business continuity, and reputation.
Utilize different graph scenarios to track the attack surface changes over time and measure your mitigation plan’s effectiveness and the focus going forward. The graph model considers attacker capabilities and movement between various vulnerabilities.