As the chief information security officer (CISO), you are responsible for your organization’s information and data security. In the past few years, cybersecurity attacks and breaches have increased, which present even more challenges to the CISO’s role: The CISO must build the organization’s security strategy, protect against a data breach, plan disaster recovery, business continuity solutions, and more. Successful CISOs must learn about new technologies, pinpoint vulnerabilities, and stay on top of the ever-evolving threat landscape. You must also collaborate with management and senior stakeholders, and present overall security status, business impact, forecast, and plans.
As part of CYE’s baseline vulnerability and comprehensive assessment activities, a CISO can get a clear picture of security issues within the organization—and there could be many of them. In an ideal world, you would fix everything. Realistically, however, organizations’ budgets and time are limited.
You are probably asking yourself, how should I start? What should be my focus? How do I prioritize work to yield the most effective results, putting my organization in a better position?
CYE’s Hyver mitigation planner and prioritization tools are here to help.
What is Hyver’s mitigation planner?
Hyver’s visualization mitigation graph provides a clear and concise depiction of every attack route to the organization’s critical assets, allowing the organization to manage, prioritize, and plan the mitigation of vulnerabilities (findings) in order to reduce security risk.
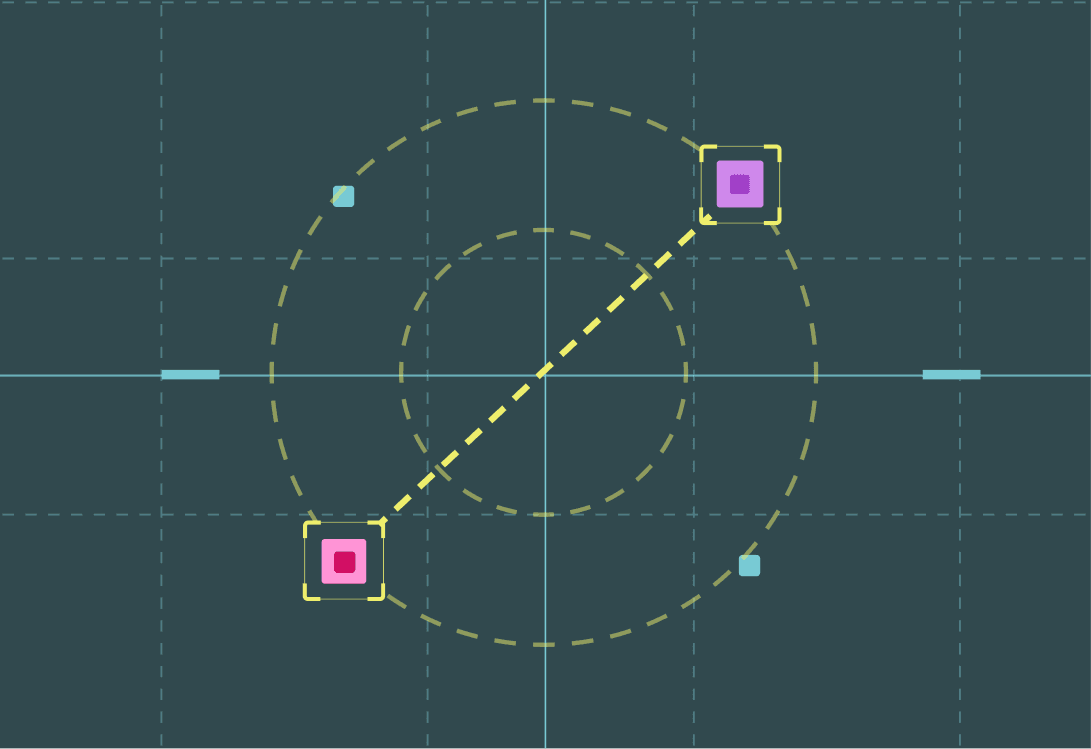
Hyver’s mitigation graph displays all the attack routes to the customer’s critical business assets and highlights the most severe vulnerabilities. These attack routes are shown as a sequence of arrows drawn from the attack threat source on the left (such as external attackers from the internet, inside attacker, third-party vendor), through the enterprise’s assets (edges), all the way to the organization’s critical business assets on the right (such as employee information, business continuity, and sensitive data). Each route starts from a threat source and ends with a breach of one or more of the enterprise’s critical assets.
An edge is represented as a line drawn from one position to another. Each edge between two positions typically represents a finding, which is a vulnerability detected by CYE. A finding has a probability/likelihood value of 0-1, reflecting the possibility that a certain finding will be exploited and therefore was detected during an assessment. The likelihood takes into account the complexity, popularity, and the user interaction with the vulnerability/finding.
An attack route (shown as a sequence of edges/lines), simulates an attack from a threat to business asset.
How to build an effective mitigation plan
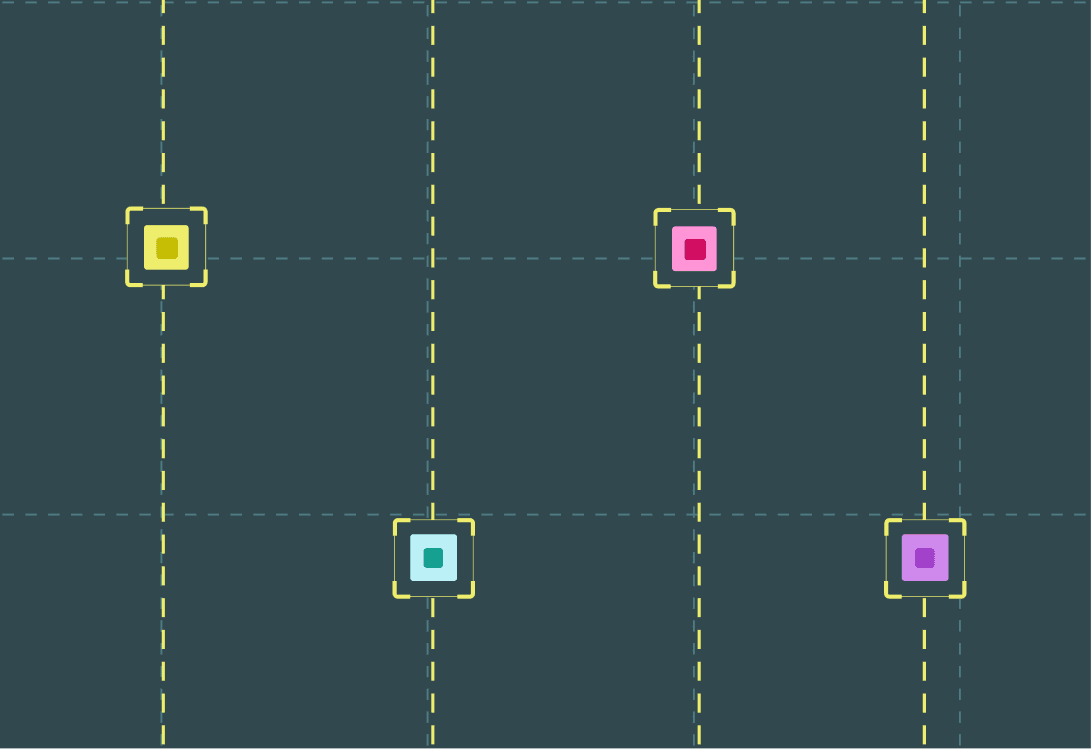
Hyver’s unique priority mechanism evaluates all findings and attack routes, vulnerabilities with the highest probability, and those that are the most critical to block**,** which are indicated by a blue solid line and arrow. These are the ones that you should fix first.
The priority algorithm of Hyver considers a wide range of factors, and the significant factor is determined by:
Exposure**.** Findings are prioritized primarily by the exposure of the business assets, which is the likelihood of each business asset multiplied by the cost of breach (impact). Mitigating findings by exposure order reduces the risk of business assets with the highest exposure.
Importance**.** Findings are prioritized primarily by the business asset importance. Mitigating findings by importance order reduces the risk of the most important business assets for the organization.
Hyver’s findings view provides an overview of all prioritized findings (from 1 to n) so that you can plan and prioritize mitigation efforts in order to resolve and disconnect vulnerable attack routes. An edge line is automatically removed from the mitigation graph when a finding is mitigated.
By building a mitigation plan using Hyver’s Mitigation Planner, you can mark specific findings on the graph as if they were fixed to see their effect on attack route edges. This visual and smart mitigation optimization algorithm tool identifies the routes that will disconnect the maximum number of attack routes. This allows you to mitigate findings in the most efficient manner according to their severity, required budget/resources for remediating each finding, and according to the amount of time required to fix each finding.
Hyver creates four out-of-the-box mitigation plans that provide insights and a decision–making tool: Critical to Block, Most Probable Route, Lowest Cost Level and Lowest Effort Level. Each one simulates the problems to be fixed and their cost and effort implications so that you can forecast the impact.
An organization’s environment is constantly changing, and so it is very important to be able to protect the organization as attack methods and landscapes evolve. Therefore, it is recommended to track progress and make changes as necessary. You can save and create multiple plans as necessary.
You can also select specific findings of interest to add to the mitigation plan. When added, the graph is automatically updated reflecting the impact of fixing the selected finding. This enables you to select the right finding to address first so as to avoid a possible disconnection of business assets.
How to reduce risk to the organization
Fixing all Critical to Block findings will directly achieve the most security, the least exposure, and reduce the most risk at the lowest cost. It is recommended to list the organization’s business assets to be protected in the order of their importance to the organization.
Hyver calculates the probability of attack. This insightful widget enables you to see an at-aglance view of the business assets with the highest impact that are most likely to be attacked. Having the importance, likelihood, and impact (cost of breach) in financial data can provide the CISO and the management team with a clear picture of the exposure and the risk to the organization.
All organizations seek to avoid losing money and any negative impact on their business. By having a risk exposure value, the business can make smart decisions, including where to invest and how much.
Conclusion
In the last year, the cost of data breaches has increased by 10%, and cyberattacks are far from being eliminated. CYE’s Hyver mitigation tools and the use of additional security tools and processes can help you reduce your risk exposure and keep your organization safe.
An understanding of your business impact—rather than just specific technical aspects—as well as planning, prioritization, and focusing on what impacts the most are the keys to success.
Want to learn more about how Hyver’s mitigation planner can help your organization? Contact us for more details.
- risk experts
- cisos
- cyber strategy